Indicator 10: Mechanisms of Monitoring and Evaluating Systems:
Are monitoring and evaluation data regularly collected and used to improved infant and young child feeding practices?
In last month’s blog Patricia Wise explained how monitoring and evaluating breastfeeding rates is the 10th and final indicator of any World Breastfeeding Trends Initiative report, including the UK one . This blog shows how the data can be used as a tool to inform decision-making, especially for commissioning services, to reduce inequalities in child health.
Public Health datasets
Public Health England Early Years Profiles allow for measures of infant health based on International Classification of Diseases codes (ICD10) to be tracked over time and compared with statistically similar areas across England. It needs local knowledge to interpret findings as you are looking for patterns, or signals, in amongst the noise of coding and other errors. Decision-making is hard when there are gaps or significant errors in the data so it is worth spending time with all involved to improve the quality of the data.
As an example, Northumbria Healthcare NHS Foundation Trust recently received the first Health Visiting Baby Friendly Achieving Sustainability Gold Award, demonstrating a long term commitment to implementing the Unicef UK Baby Friendly Initiative. The Trust is in the 4th most deprived decile (a decile is 1/10 of the population) in England (IMD2010) so a good example of what can be achieved in communities with areas of disadvantage.
In the Northumberland PHE area (which includes Northumbria NHS Trust), breastfeeding prevalence rates at 6-8 weeks have increased 2 percentage points between 2010/11 and 2014/15. Opportunities for assessing wider measures of child health from the Early Years Profiles are limited so Northumberland is unusual in having data available for gastroenteritis hospital admissions for two consecutive years. These reduced from 29 per 1,000 babies under one in 2014/15 to 19 per 1,000 in 2015/16. Other factors will also contribute but there is good evidence that breastfeeding reduces the incidence of gastroenteritis and associated NHS cost savings have been calculated .
Comparing Northumberland to neighbouring trusts in the graph below, its hospital admission rate for gastroenteritis sits on the regression line. Darlington and North Tyneside have more admissions (32/1,000 and 31/1,000) while Gateshead has similar admissions to Northumberland at 20/1,000. However, all these four areas have similar breastfeeding rates. Local knowledge is key though to trying to understanding differences as South Tyneside has a low admission rate at 11/1,000 with lower breastfeeding rates.
Breastfeeding prevalence at 6-8 weeks compared with hospital admissions for infants with gastroenteritis in the North East Region
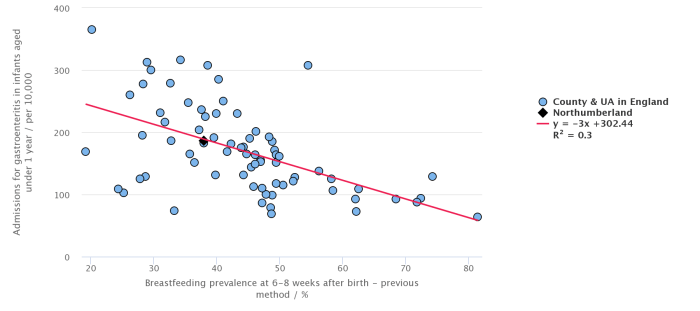
X axis =Breastfeeding prevalence at 6-8 weeks – previous method
Y axis = Admissions for gastroenteritis in infants under 1 year
https://fingertips.phe.org.uk/profile-group/child-health/profile/child-health-early-years/data#page/10/gid/1938132986/pat/6/par/E12000001/ati/102/are/E06000057/iid/20202/age/170/sex/4 [accessed 13 November 2017]
(Link defaults to A&E attendances so Y-axis needs resetting each time to ‘admissions for gastroenteritis under 1 year’. You can vary the Area on the interactive chart, as in the table below, to see each of them highlighted as a black diamond. Areas mentioned in the blog are highlighted in bold in the table.)
Using the Public Health England data
The graph on the PHE site is interactive. Comparing breastfeeding rates at 6-8 weeks with gastroenteritis rates for under 1 year olds shows the prevalence of gastroenteritis decreases as breastfeeding rates increase, as seen by the regression line. However, the variations in hospital admission rates also reduce and stabilise as the breastfeeding prevalence rates exceed approximately two thirds of the population. The reason for this is not clear. It could be an indication of a longer average duration of breastfeeding, or more exclusive breastfeeding within the population or other factors. The differences between similar communities indicate these admissions can be reduced. Since October 2015 the breastfeeding data have been obtained via interim reporting arrangements to collect health visiting activity at a local authority resident level. This new method is not comparable with the previous method so it will take some time to understand any future trends (PHE Definitions for indicator 2.02ii, Indicator ID 20202).
“In health care, geography is destiny”
Reducing these unnecessary variations in breastfeeding improves child health, helping to reduce inequalities (WBTi report p4). The impact of cuts to peer support, health visiting teams and Children’s Centres may be demonstrated within the PHE data through increasing demand for hospital services. Where children grow up influences their health.
“In health care, geography is destiny” (Wennberg, 2010).
| North East Area | Breastfeeding Prevalence Rate 6-8 weeks previous method (%) | Admissions for gastroenteritis in infants under 1 year / per 10,000 | Admissions for gastroenteritis in infants under 1 year / per 10,000 |
| 2014/15 | 2014/15 | 2015/16 | |
| County Durham | 28.9 | 339.6 | 312.7 |
| Darlington | 34.2 | 515.0 | 316.8 |
| Gateshead | 37.2 | 227.2 | 204.3 |
| Hartlepool | 20.2 | 300.5 | 364.5 |
| Newcastle | 46.2 | 348.6 | 201.1 |
| Northumberland | 38 | 292.7 | 185.5 |
| North Tyneside | 38.5 | 393.3 | 307.6 |
| South Tyneside | 24.4 | 244.3 | 108.8 |
| Stockton-on-Tees | 29.6 | 230.6 | 300.5 |
| Sunderland | 26.2 | 355.3 | 259.8 |
*Middlesbrough and Redcar and Cleveland have been omitted from the table as the previous method of collecting breastfeeding data was not available.
Data on gastroenteritis and explanation on definitions available at
https://fingertips.phe.org.uk/profile-group/child-health/profile/child-health-early-years/data#page/4/gid/1938132994/pat/6/par/E12000001/ati/102/are/E06000003/iid/92517/age/170/sex/4
References
Renfrew, MJ, Pokhrel S, et al. Preventing disease and saving resources: the potential contribution of increasing breastfeeding rates in the UK. Unicef UK BFI
Accessed 16 November 2017-11-16.
Rollins N, Bhandari N et al (2016) ‘Why Invest, and What It Will Take to Improve Breastfeeding Practices?’ The Lancet 387: 491–504.
http://www.thelancet.com/series/breastfeeding
Accessed 15 November 2017
Victora CG, Bahl R et al (2016) ‘Breastfeeding in the 21st century: Epidemiology, Mechanisms, and Lifelong Effect’ The Lancet Series: Breastfeeding 1 387(10017): 475–490
http://www.thelancet.com/journals/lancet/article/PIIS0140-6736(15)01024-7/fulltext
Accessed 15 November 2017
Wennberg, J. E. (2010). Tracking medicine: a researcher’s quest to understand health care, Oxford, Oxford University Press.

Phyll Buchanan is a Breastfeeding Network Supporter, tutor and trustee.
Phyll has completed her MSc in Evidence-based Health Care.
